前言
现在网络结构越来越复杂,虽然可以直接阅读代码来理解模型的前馈过程,但是一行行阅读下来会比较耗时间。如果先通过可视化工具对模型结构有大致的了解,那么再阅读模型代码也会高效很多。
神经网络可视化工具可用于检查神经网络结构设计的合理性,确认网络各个节点的tensor的维度,从而便于修改和优化模型结构。
可视化模型结构的方法
[方法1] 使用netron可视化onnx模型
安装及使用
在terminal中,使用pip安装:
pip install netron
然后创建一个python脚本test_netron.py,输入如下内容:
import netron
import torch.onnx
from torch.autograd import Variable
from torchvision.models import resnet18

model = resnet18()
x = torch.randn(5, 3, 40, 40)
model_onnx_path = "./nnet.onnx"
torch.onnx.export(model, x, model_onnx_path)
netron.start(model_onnx_path)
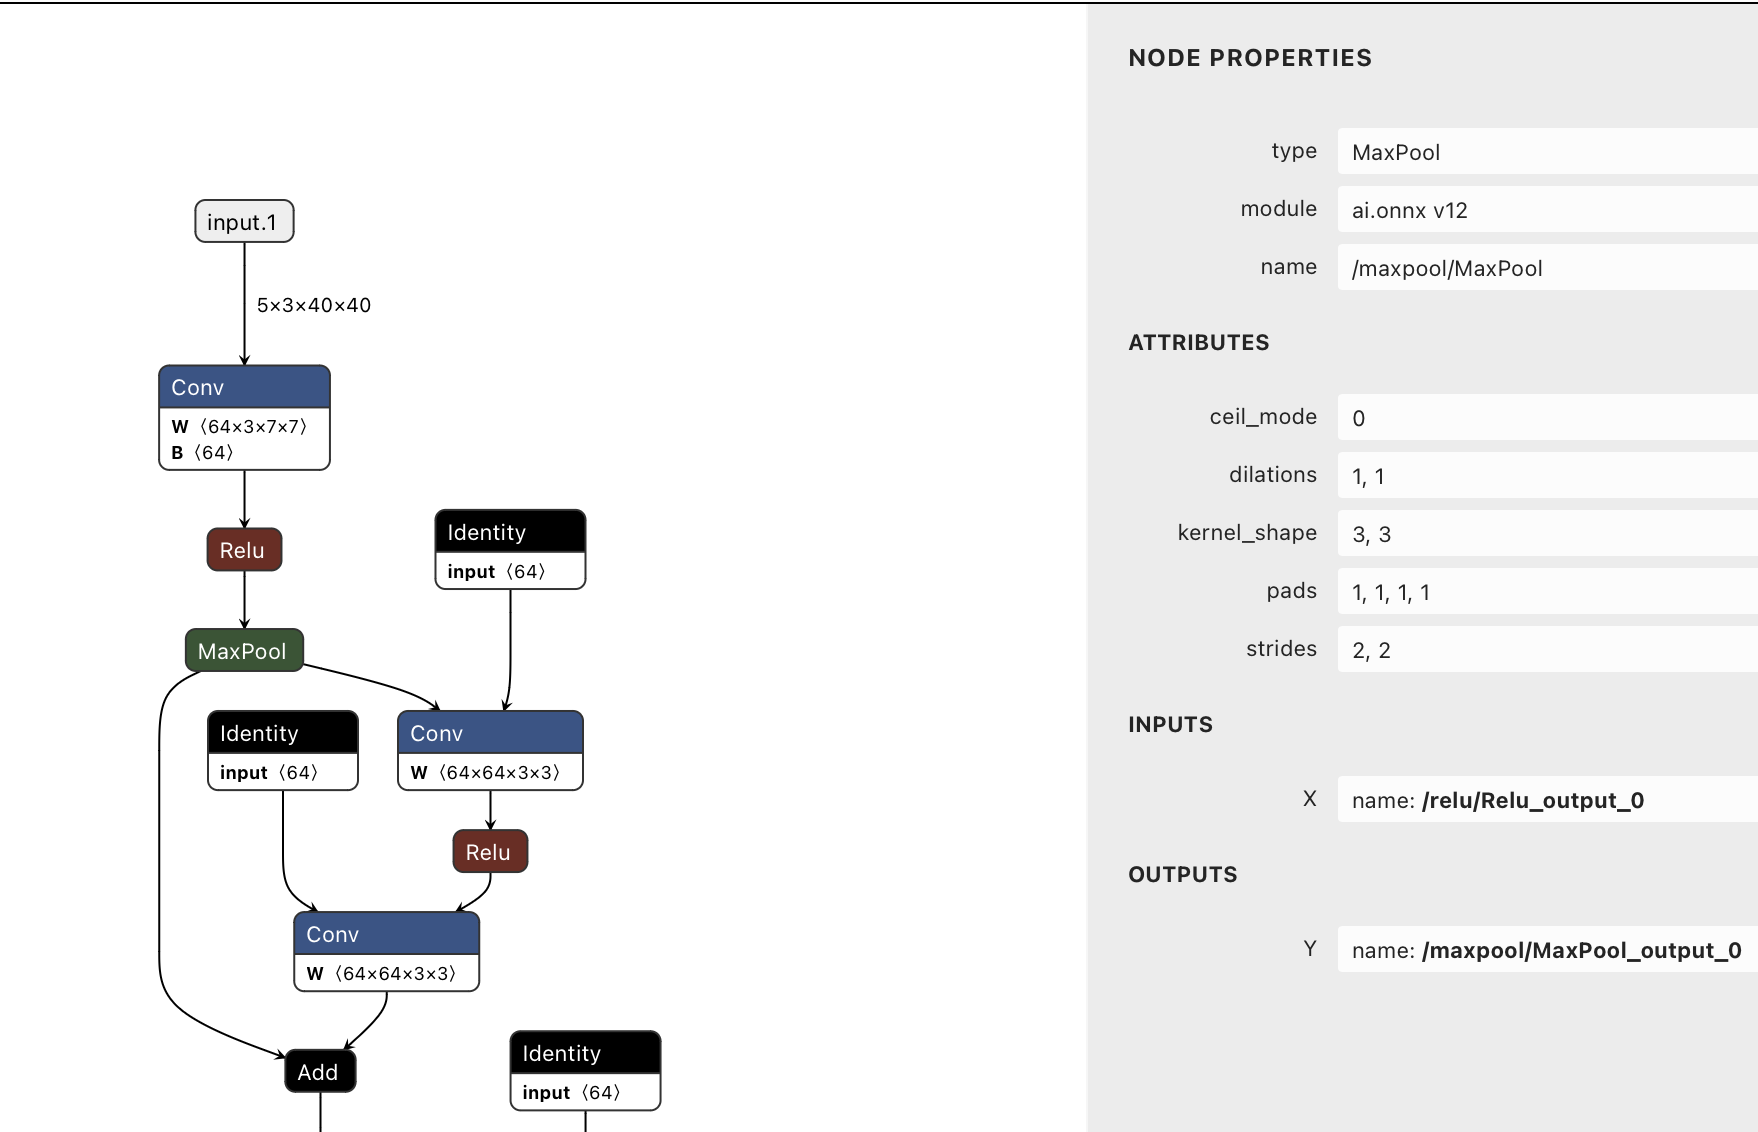
执行这个test_netron.py脚本,会自动打开电脑的网页浏览器,有一个页面显示网络结构:

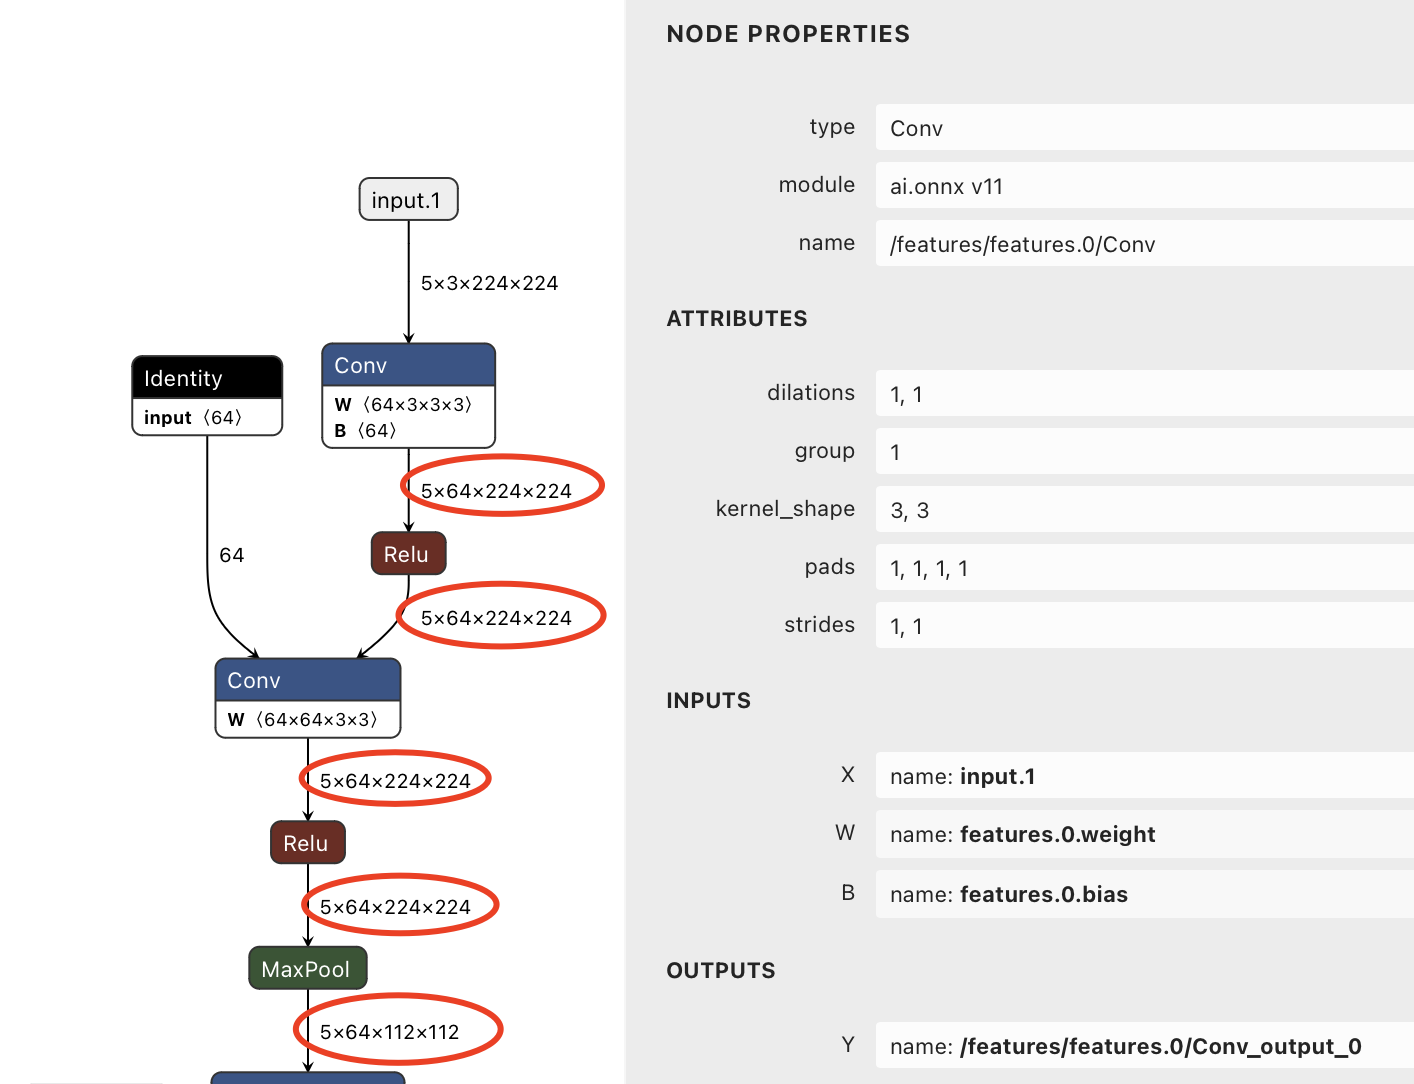
此外,如果想在上图的基础上,显示每一层输出的feature map的尺寸,可以尝试运行下面的脚本:
import netron
import torch
import torch.onnx
from torchvision.models import resnet18, vgg16

model = vgg16()
x = torch.randn(5, 3, 224, 224)
model_onnx_path = "./nnet.onnx"
torch.onnx.export(model, x, model_onnx_path, opset_version=20) # If opset_version is too new, the onnx.shape_inference may not work.

import onnx
from onnx import shape_inference
onnx.save(onnx.shape_inference.infer_shapes(onnx.load(model_onnx_path)), model_onnx_path) # use onnx.shape_inference to make later netron visualization show intermediate layers' feature map size

netron.start(model_onnx_path)
执行脚本后应该可以看到可视化结果额外显示了中间层输出的feature map尺寸(红圈处):

[方法2] 使用torchviz可视化pytorch模型
相比netron是从向前传播的角度来观察模型各层的情况(读取onnx模型),torchviz是从反向传播的角度来观察模型结构(读取pytorch模型)。torchviz相比netron有一个重要的区别是,它可以显示你定义的层的名字(比如你在pytorch模型中定义一个层self.fc_large = Linear(),它会显示fc_large,而netron只会显示Linear)。
在terminal中安装graphviz和torchviz:
# MacOS Example
brew install graphviz
pip install torchviz
尝试运行下面的脚本:
import torch
import torch.nn as nn

class Net(nn.Module):
    def __init__(self):
        super().__init__()
        self.input = nn.Linear(in_features=8, out_features=16)
        self.hidden_1 = nn.Linear(in_features=16, out_features=16)
        self.output = nn.Linear(in_features=16, out_features=6)

    def forward(self, x):
        x = torch.relu(self.input(x))
        x = torch.relu(self.hidden_1(x))
        return self.output(x)

from torchviz import make_dot
model = Net()
X = torch.randn(5, 8)
y = model(X)
vis_graph = make_dot(y.mean(), params=dict(model.named_parameters()), show_attrs=True, show_saved=True)

vis_graph.format = 'png'
vis_graph.render('model_arch') # save visualization result
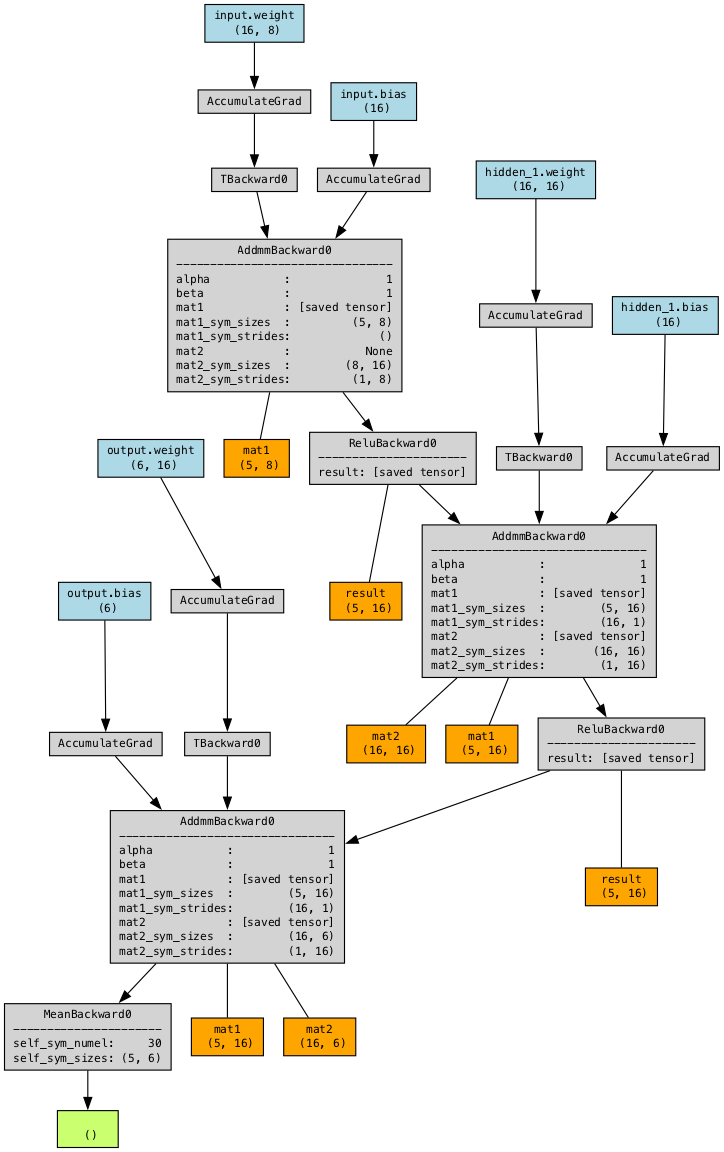
执行完脚本后,应该会生成一个叫model_arch.png的图片,如下图:

如果不想显示那么多内容,可以选择不在make_dot中设置show_attrs和show_saved:
vis_graph = make_dot(y.mean(), params=dict(model.named_parameters()))